
Every year, the Oscars give us plenty to talk about, from surprise wins to controversial snubs and unforgettable performances. Awards season always sparks debates about who should have taken home the gold.
But beyond the red carpet and acceptance speeches, there is another way to look at the Academy Awards: through the lens of data.
This year, our Business Intelligence (BI) team built a set of dashboards to explore Oscar history and this year’s nominees from a new perspective. Instead of focusing only on predictions or winners, they asked deeper questions: Do heroes or villains win more acting Oscars? And how closely do critics and audiences actually agree on the year’s best films?
The result is two dashboards that reveal some fascinating insights behind Hollywood’s biggest night.
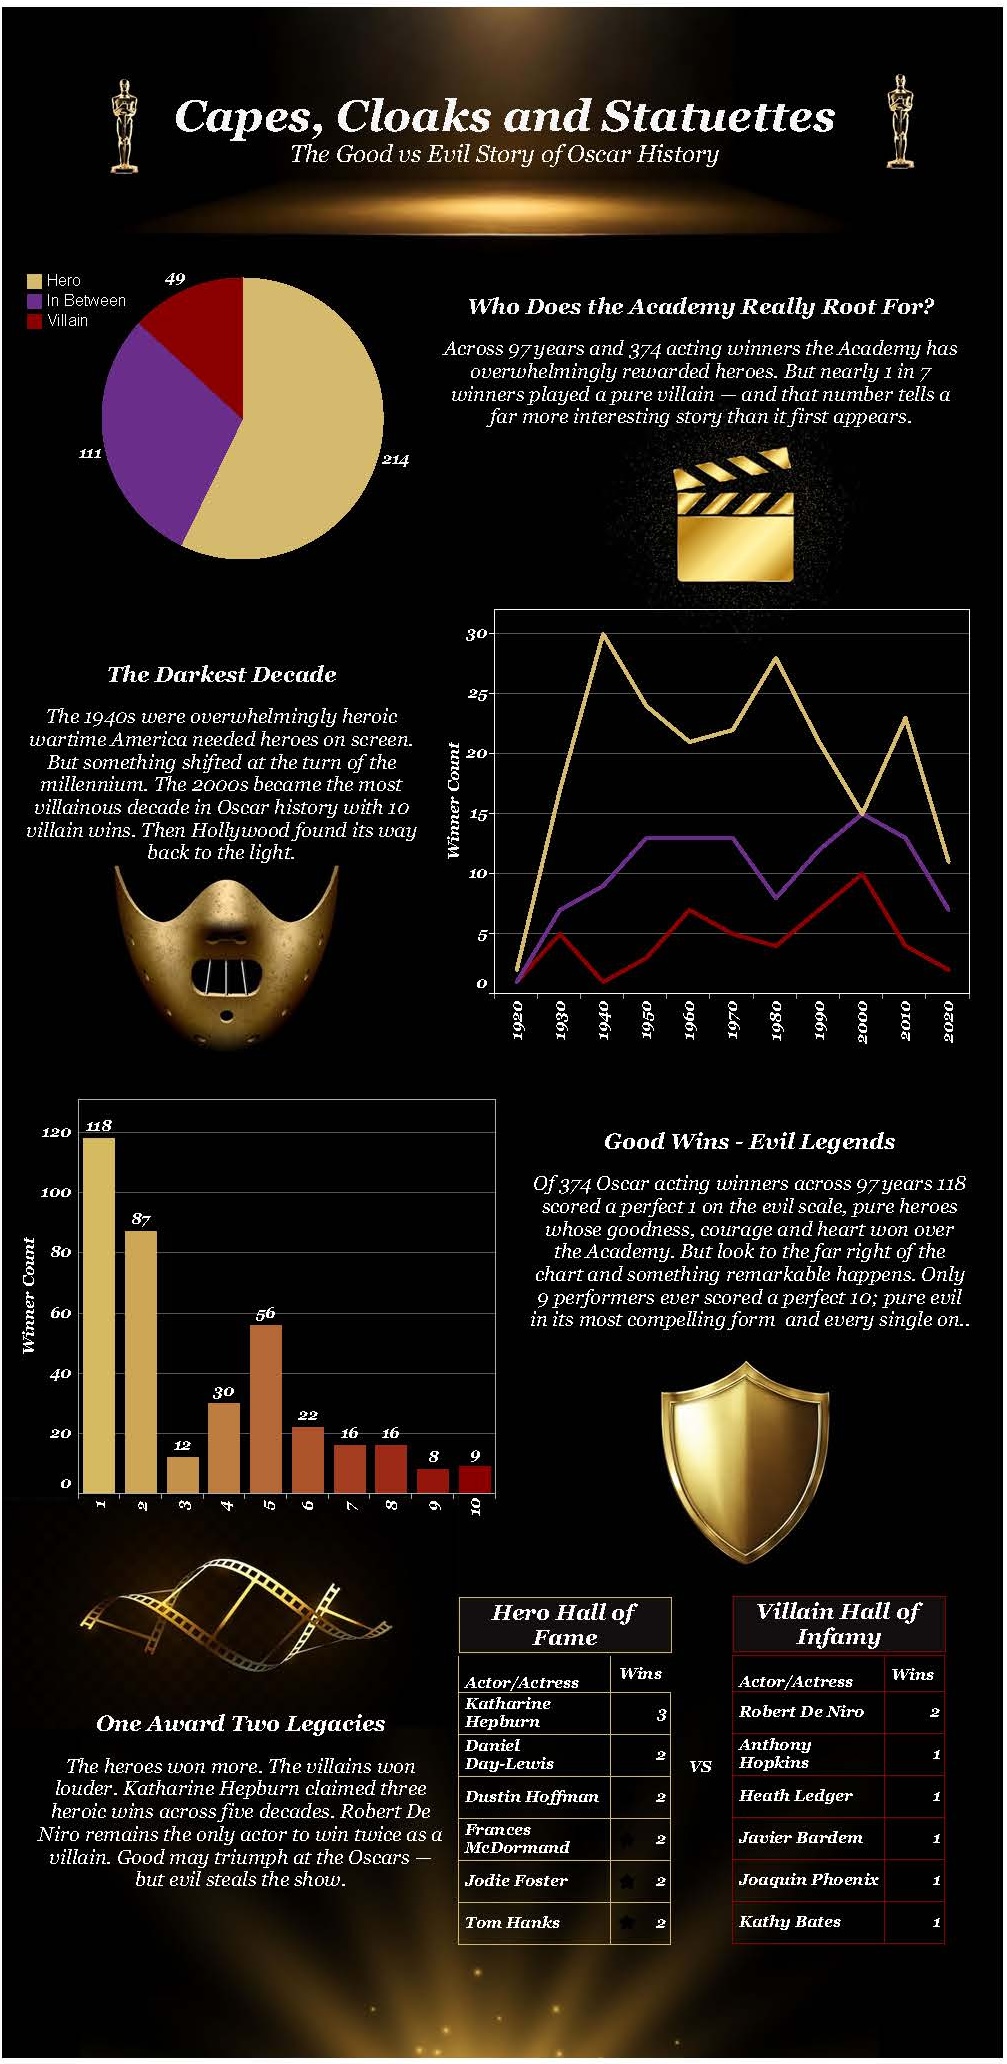
The first dashboard explores nearly a century of Oscar-winning performances through a unique lens: good versus evil.
Michelle Vega, Senior BI Analyst, built the dashboard after noticing that while awards season is full of debate, one question rarely comes up.
"Every awards season, we debate who should have won. But nobody ever asks the more interesting question: does it matter whether they played a hero or a villain?"
As both a film fan and a data enthusiast, Vega decided to investigate.
"Using 97 years of Oscar acting history, I set out to answer one simple question: does good or evil win at the Oscars? The answer surprised me."
To explore the idea, Vega analyzed 374 Oscar-winning performances across Best Actor, Best Actress, Best Supporting Actor, and Best Supporting Actress. Each role was evaluated on an evil scale from 1 to 10 to determine where it fell on the moral spectrum.
The results reveal a compelling pattern.
"Heroes dominate the gold, but villain wins are the performances nobody ever forgets."
The dashboard uncovers several interesting insights, including the most heroic decade in Oscar history and the nine performers who scored a perfect 10 on the evil scale. Together, these findings reveal what Vega describes as "the surprising moral story hiding behind a century of Hollywood’s biggest night."
The second dashboard shifts focus to one of the most discussed categories during awards season: Best Picture.
For Brent Gilchrist, BI Analyst, the most interesting part of this category is not just the nominees themselves; it is how differently audiences and critics respond to them.
"The Best Picture nominees are always the most interesting part of the Oscars to me. What I find most fascinating is the gap between what casual audiences and critics like."
To visualize that divide, Gilchrist used a dumbbell chart, which connects critic and audience ratings for each film to show the difference at a glance.
"I chose a dumbbell chart because it felt like the best way to visualize that gap literally. There are so many potential stories to tell with data about each of these nominees, but I decided to restrain myself and stick to a visual that is cleaner and easier to read at a glance."
The dashboard highlights several interesting contrasts among this year’s nominees. For example, F1, a big-budget action film, is the movie audiences liked significantly more than critics.
Meanwhile, The Secret Agent was the critics’ favorite, despite only grossing about $17 million worldwide after its debut at the 2025 Cannes Film Festival.
Another standout is Sinners, which had over 25,000 reviews, the highest of any nominee.
"Sinners had the highest number of reviews, with over 25,000, making it impressive that it also has the smallest gap in ratings."
Despite this alignment between critics and audiences, betting markets still favor another film.
"One Battle After Another takes the crown as most likely to win," Gilchrist notes. "Being a heavy favorite despite the 9-point gap in ratings between audiences and critics really highlights the disconnect in what critics award versus what audiences look for."
.png)
The Oscars have always been about storytelling, but data can reveal an entirely different set of narratives beneath the surface.
By analyzing nearly a century of acting performances and comparing modern audience and critic reactions, these dashboards uncover patterns that might otherwise go unnoticed, from the dominance of heroic characters to the ongoing divide between critical acclaim and audience enthusiasm.
Awards season will always spark debate, but with the help of data, we can start to understand why those debates exist in the first place.
If you are looking to unlock insights from your own data, Concord’s BI team can help turn complex information into dashboards and visualizations that tell clear and actionable stories. Contact us to see how we can help your organization make smarter, data-driven decisions.

Not sure on your next step? We'd love to hear about your business challenges. No pitch. No strings attached.


