
The Winter Olympics are full of incredible performances, dramatic moments, and memorable wins. But there’s more to the story than just who stands on the podium. Our Business Intelligence (BI) team decided to dig into the data behind the Games. Using BI tools and decades of historical Olympic results, we built dashboards and visualizations that uncover patterns, upsets, and trends you might not notice while watching the events live.
From Germany’s dominance in luge to the Miracle on Ice, from countries’ long-term medal efficiency to record-breaking ski jumps, our dashboards turn Olympic history into interactive stories that are as fun to explore as the Games themselves.
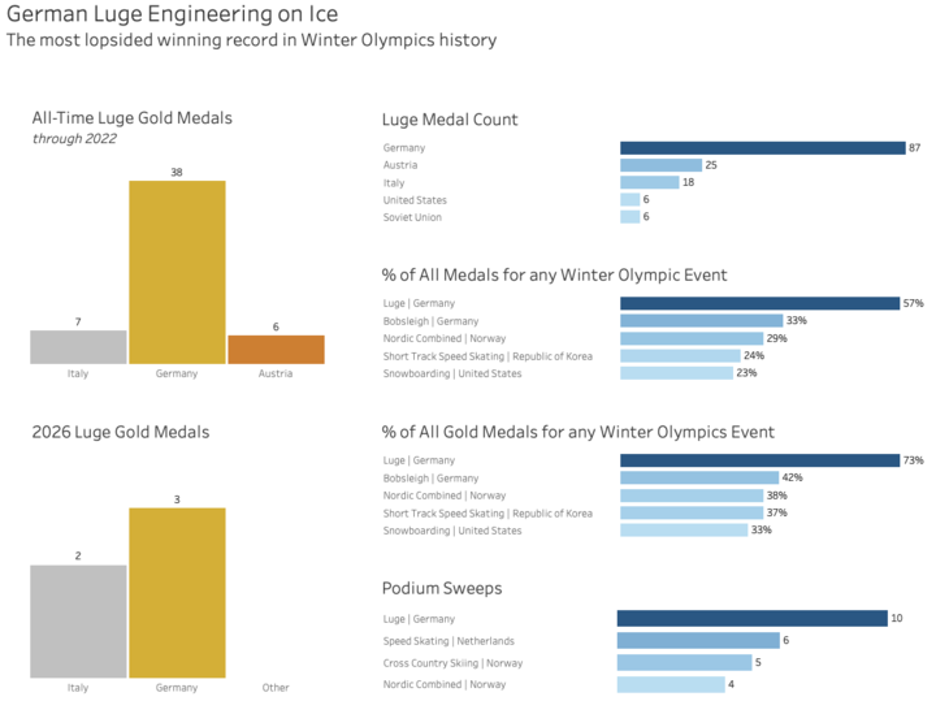
Matt Jenkins, BI Analyst, focused on one of the fastest and most precise sports in the Winter Olympics: luge.
Germany has been remarkably dominant in luge throughout Winter Olympics history. Through 2022, German athletes have won 38 gold medals for luge, far ahead of Italy with 7 and Austria with 6. At the 2026 Games, Germany added three more gold medals, further extending its lead.
“This dashboard was developed with Tableau to visualize Olympic performance for each event. The visuals aggregate participant and placement data to highlight the success of German luge athletes compared to the total participant field. Bar charts show the gap between German luge medals and the medal counts across all other Olympic sports,” Matt said.
The data comes from Olympedia.org via Kaggle, providing a complete historical view of Olympic luge results. Matt’s dashboard highlights Germany’s sustained success and uncovers trends that might be missed during individual races.
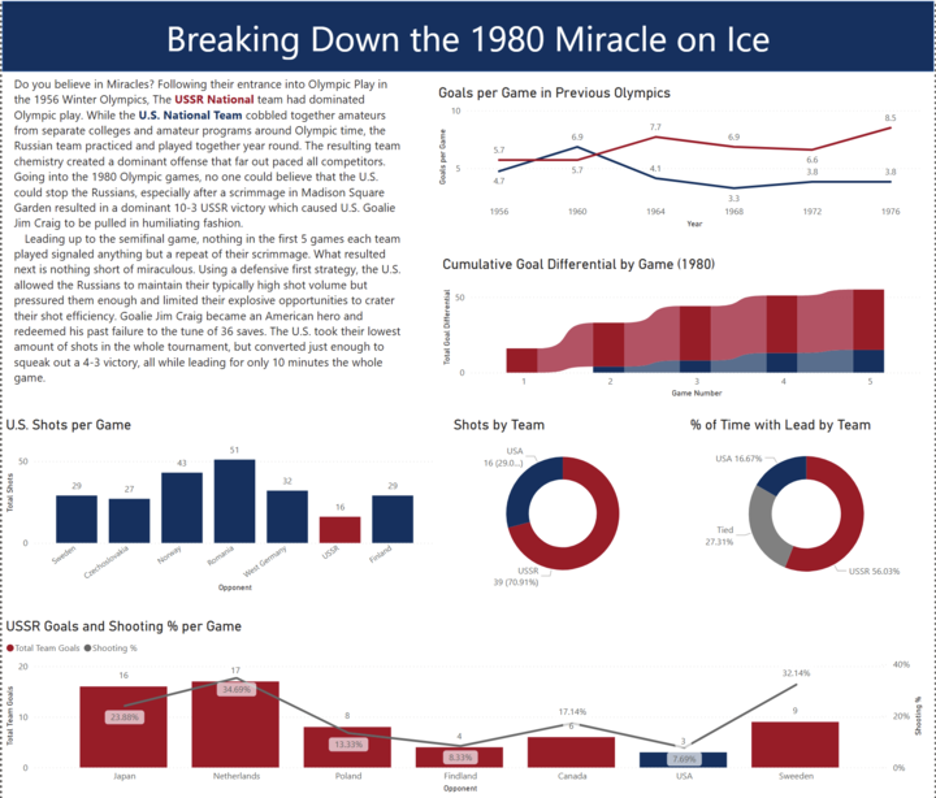
Brent Gilchrist, BI Analyst, focused on one of the most famous moments in Winter Olympic history: the 1980 U.S. hockey victory over the Soviet Union.
“I thought it would be fun to try and capture the upset in numbers,” Brent said. “I also watched the movie Miracle countless times as a kid, so I had a personal connection to the story.”
Brent ran into several challenges while building his Power BI dashboard. Verifying historical data for Olympic games dating back to 1950 was no easy task, as reliable records were limited and often inconsistent. He initially sourced older statistics from Quant Hockey and then crossed-checked those figures against official Olympic reports to ensure complete accuracy. Information on the 1980 scrimmage games – where the U.S. team was heavily outscored by the Soviets – was also limited to basic scores and goal scorers. On top of that, condensing such a historic and complex story into a single-page dashboard proved difficult given the broader context surrounding the game.
Despite these challenges, his resulting dashboard captures the compelling story of how the U.S. defeated one of the greatest offenses in Olympic history while taking fewer shots and allowing the USSR to control much of the game. “It took a historic performance from the goalie and a disciplined defense to win. It really feels like they got the 1-in-10 outcome Herb Brooks talked about,” Brent said.
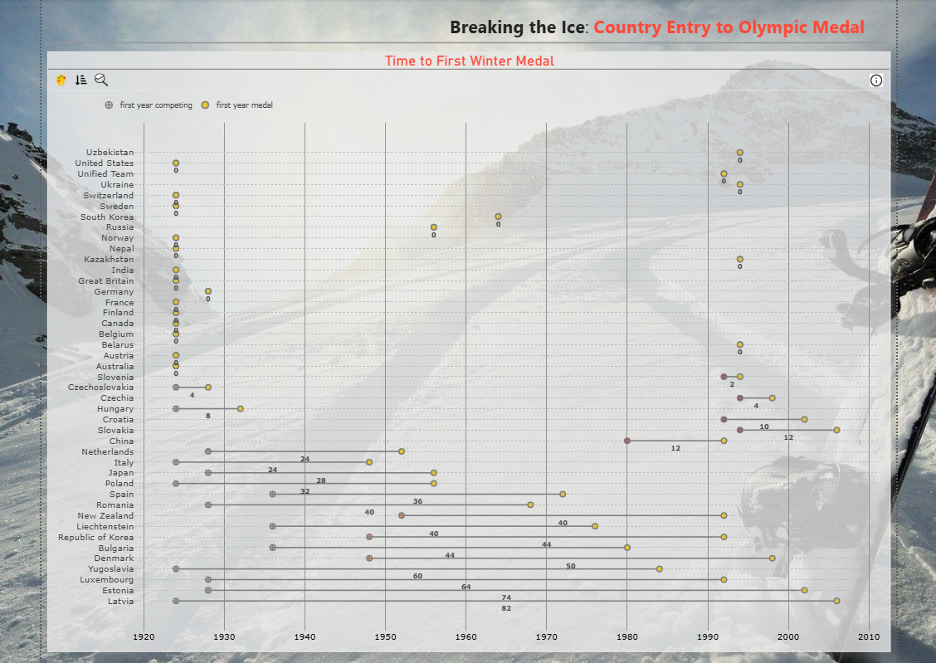
Michelle Vega, Senior BI Analyst, explored how quickly countries reach the podium after entering the Winter Olympics.
“Some countries take off immediately, winning medals soon after they first compete, while others take longer to reach the podium,” Michelle said. “A dumbbell chart tells this story, showing the gap between each country’s first year competing and the year they won their first medal.”
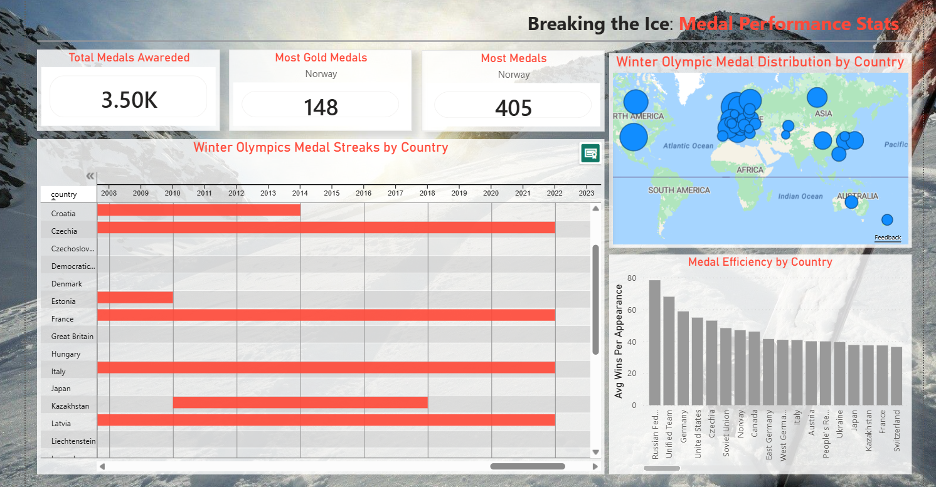
Michelle also analyzed long-term performance trends. “The medal breakdown by country reveals which nations dominate the podium, and medal efficiency shows how effectively each country turns appearances into wins,” she explained.
“Countries like Norway and German illustrate this perfectly – not only do they achieve early success, but they sustain long streaks across decades, reflecting strong programs and experience, while countries with smaller pools or fewer resources often experience shorter, more sporadic success.”
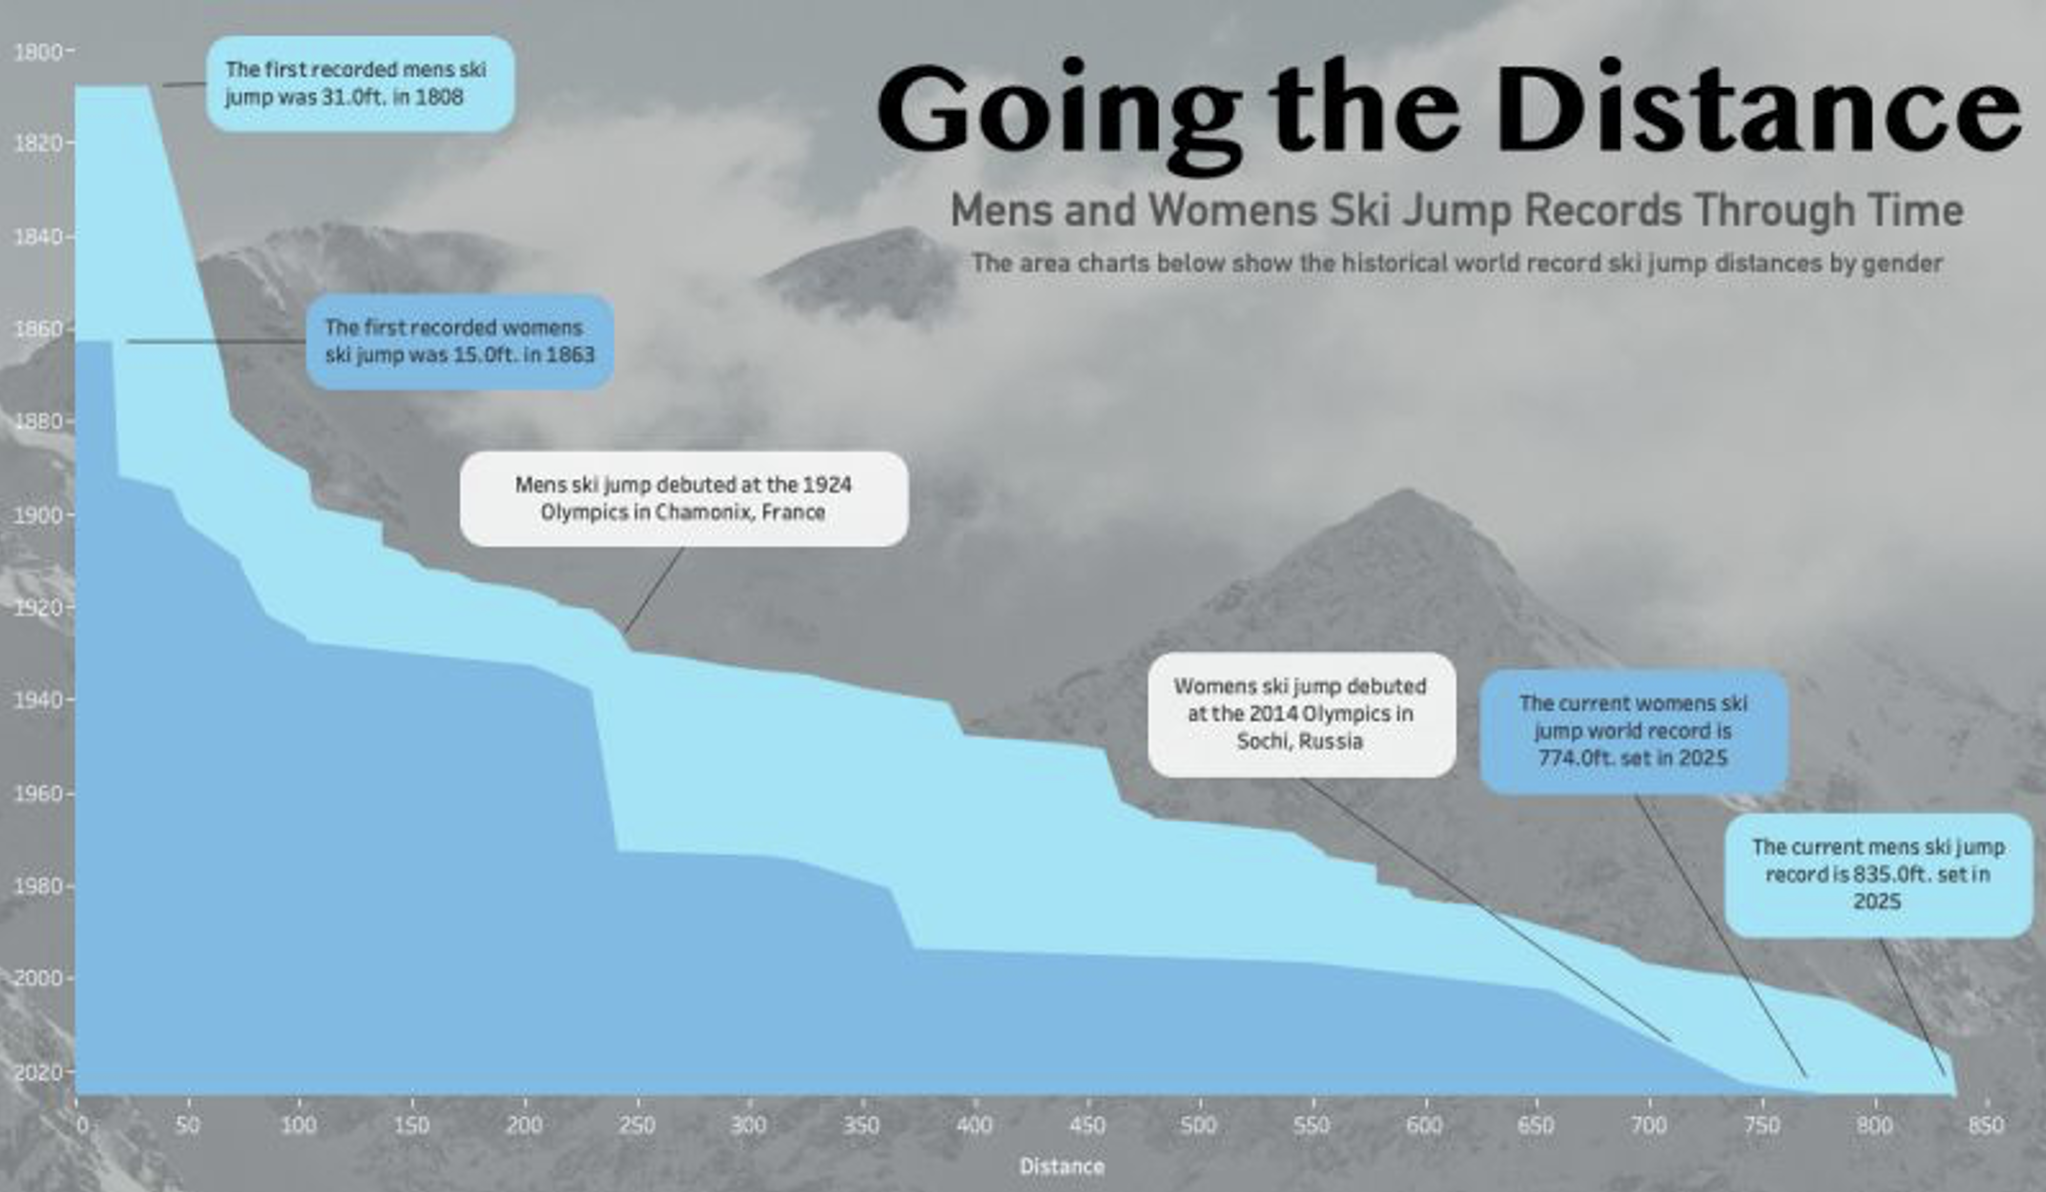
“What an incredible month of athleticism, sportsmanship, and competition,” Sean Miller, Principal Consultant, said. “If there’s one Olympic sport I’d love to try, it would be the large hill skill jump. There’s something endlessly fascinating about watching athletes launch themselves off a ramp and soar through thin air.”
To celebrate the sport, Sean pulled historical world record jump distances from Wikipedia and built an infographic in Tableau. “Exploring the data and watching the records grow over time was genuinely fun,” he added.
The numbers put the sport’s evolution into perspective. “The first ever recorded men’s jump in 1808 covered roughly the same distance as a single first down in American football. The current world record? Longer than 2.5 football fields. And women’s ski jumping, which debuted at the Olympics in 2014, already has a world record stretching past 774 feet.”
Through data and visualization, Sean’s dashboard highlights just how dramatically ski jumping distances have progressed over time.
These Winter Olympics dashboards demonstrate how data can bring deeper context and clarity to iconic moments and long-term performance trends alike. While analyzing the Games is a fun challenge, our BI team applies the same analytical rigor every day to help businesses navigate complex data environments. Whether you’re looking to measure performance, identify opportunities, or turn insights into action, we’re ready to help you move forward with confidence.

Not sure on your next step? We'd love to hear about your business challenges. No pitch. No strings attached.


