Many business scenarios require you to analyze data from more than one transactional source. For example, you might need to compare sales data with returns data, or sales targets with actual sales. Simply connecting these fact tables directly can lead to a messy, unworkable data model. The key to success lies in a foundational principle of dimensional modeling, the use of shared dimension tables.
This blog will walk you through building a Power BI model that effectively integrates multiple fact tables using a practical, step-by-step example.
Imagine a retail business that wants to analyze two distinct business processes:
You have two separate fact tables:
The challenge is to analyze these two datasets together. You want to answer questions like:
Before diving into the solution, we'll first look at some of the common mistakes that can lead to a broken or inefficient data model. Understanding these pitfalls can help you identify and avoid them, setting you up for success when you build your own model.
A user might try to solve the problem of multiple data sources by creating one large, consolidated fact table. This often involves joining or appending data from different tables in Power Query. For instance, they might try to combine FactSales and FactReturns into a single, massive table that contains all transaction data.
Merging fact tables with different columns or levels of detail creates lots of blank values, slows queries, and risks incorrect totals. A single fact table works only if both have the same columns, data types, and meaning. In most cases, its best to keep them separate and use shared dimensions.
This mistake often happens when a user is new to data modeling and doesn't fully understand the concept of granularity. They might see a shared column, like ProductID, in both a FactSales table (one row per line item) and a FactSalesTarget table (one row per product per month), and assume a direct join is all that's needed. The user's goal is to compare sales to targets, and the column names match. They don't realize that the different levels of detail will lead to incorrect aggregations. The sales data, being more granular, will be over-counted when filtered by the less granular target data, resulting in misleading comparisons.
If you try to join two fact tables with different granularities directly, your calculations will likely be incorrect. Aggregating data from a less granular table to a more granular one can result in duplication and over-counting.
A user might create duplicate dimension tables when they are unsure how to set up their model. When working with two separate data sources, for example, a sales database and a returns database, a user might load a DimProduct table from the sales source and a second, separate DimProduct table from the returns source.
This creates redundant, disconnected dimension tables. When a user tries to filter on "Product," they have two different product tables to choose from. A filter applied to one dimension table will not affect the fact table connected to the other. This leads to confusing reports and incomplete analysis because the relationships are not unified.
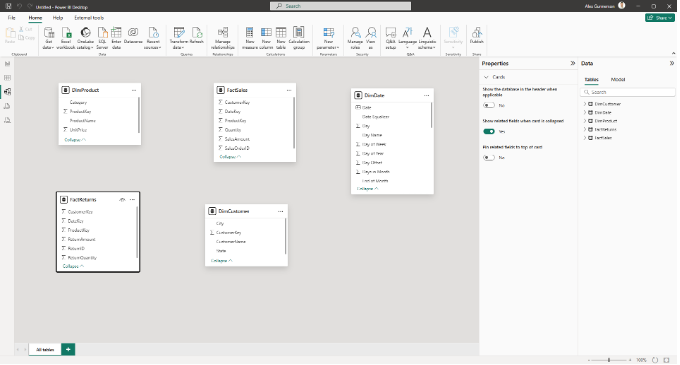
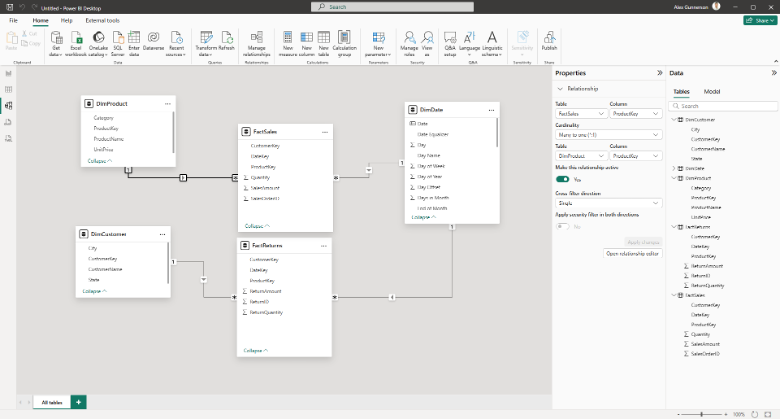
The most effective approach is to create a star schema where both of your fact tables connect to the same central dimension tables.
Each dimension table (e.g., DimProduct, DimCustomer, DimDate) contains a unique list of its members. You then establish one-to-many relationships from these dimension tables to your fact tables.
This structure allows you to use a single filter on a dimension (e.g., selecting a specific product) to simultaneously filter both the FactSales and FactReturns tables, ensuring that your visuals and calculations are always in sync.
Here's how to build this model in Power BI:
Step 1: Load Your Data
Import your fact tables (FactSales, FactReturns) and your dimension tables (DimDate, DimProduct, DimCustomer) into Power BI Desktop. If you don't have separate dimension tables, you can create them from your fact tables using Power Query. For a more detailed guide on star schemas in Power BI, checkout Power BI Data Modeling: A Complete Guide to Star Schemas.
Step 2: Navigate to the Model View
After loading your data, switch to the Model View in Power BI Desktop. This is where you'll visualize and manage your table relationships. You'll see all your tables appear on the canvas.

Step 3: Create the Relationships
Create one-to-many relationships from your dimension tables to your fact tables.
Power BI will typically create a one-to-many relationship, but you should always verify this. If Power BI creates a different relationship type (like many-to-many), it's likely due to duplicate values in the key column of your dimension table. Make sure your dimension key column has unique, non-blank values and matches the fact table’s key data type. This ensures a proper one-to-many relationship and avoids join issues. Once you're done, your model should look like an extended star schema with two fact tables at the center.

Step 4: Hide Foreign Keys
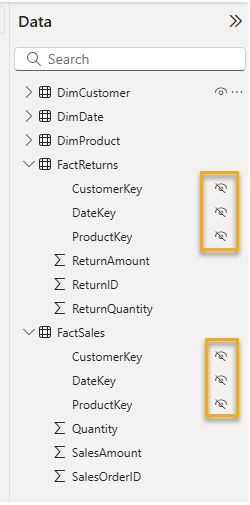
For a cleaner user experience, navigate to the Data View or Model View and hide the foreign key columns (ProductKey, CustomerKey, DateKey, etc.) in your fact tables. This prevents users from accidentally using these keys in their visuals and ensures they use the descriptive columns from your dimension tables instead.

With this model, you can now create visuals that combine data from both sales and returns seamlessly.
Sales vs. Returns by Product

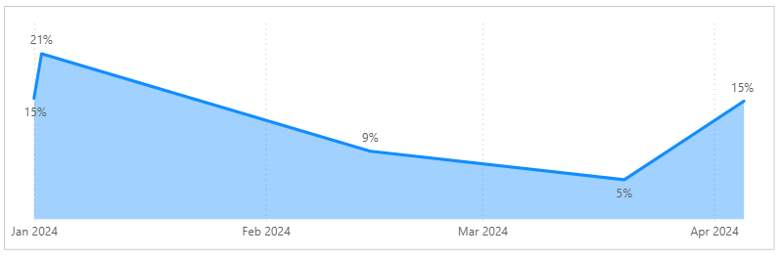
Return Rate Trending

By following this shared dimension approach, you've created a scalable and robust Power BI model that can handle complex business analysis with multiple data sources. This method not only simplifies report creation but also ensures the integrity and accuracy of your data.
Not sure on your next step? We'd love to hear about your business challenges. No pitch. No strings attached.